Second Library: Matplotlib
Matplotlib is a comprehensive library for creating static, animated, and interactive visualizations in Python.
To install matplotlib:
- Install using pip: pip install matplotlib
- Install using conda: conda install matplotlib
Matplotlib consists of the following submodules:
- matplotlib.pyplot
- matplotlib.animation
- matplotlib.artist
- matplotlib.image
- matplotlib.text
- matplotlib.textpath
There are many submodules of matplotlib.
Most of the Matplotlib utilities lies under the pyplot submodule. Each pyplot function makes some change to a figure: e.g., creates a figure, creates a plotting area in a figure, plots some lines in a plotting area, decorates the plot with labels, etc.
Introductory:
The basics of creating visualizations with Matplotlib.
Matplotlib graphs where points can be specified in terms of x-y coordinates. The simplest way of creating a Figure with an Axes is using pyplot.subplots. We can then use plot to draw some data on the Axes:
Parts of figure:

What is axes? An Axes is an Artist attached to a Figure that contains a region for plotting data, and usually includes two or three(3D).
What is axis? These objects set the scale and limits and generate ticks (the marks on the Axis) and tick labels (strings labeling the ticks).
What is artist? Everything visible on the Figure is an Artist
There are two coding style
1. object-oriented (OO) style: Explicitly create Figures and Axes, and call methods on them
2. pyplot-style: Rely on pyplot to automatically create and manage the Figures and Axes, and use pyplot functions for plotting.
Plotting x and y points:
The plot() function is used to draw points in a diagram. The function takes parameters for specifying points in the diagram. Parameter 1 is an array containing the points on the x-axis. Parameter 2 is an array containing the points on the y-axis.
import matplotlib.pyplot as plt
import numpy as np
xpoints = np.array([1, 10])
ypoints = np.array([4, 12])
plt.plot(xpoints, ypoints)
plt.show()

Plotting without line: To plot only the markers, you can use shortcut string notation parameter 'o', which means 'rings'.
xpoints = np.array([1, 10])
ypoints = np.array([4, 12])
plt.plot(xpoints, ypoints, 'o')
plt.show()
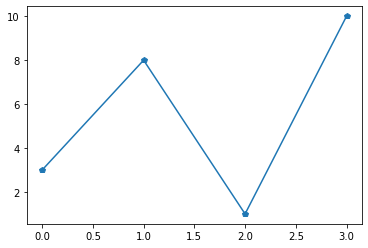
Multiple Points: You can plot as many points.
Note: You have the same number of points in both axis.
xpoints = np.array([1, 2, 6, 8])
ypoints = np.array([3, 8, 1, 10])
plt.plot(xpoints, ypoints)
plt.show()

Matplotlib Markers: To emphasize each point with a specified maker in matplotlib you can use marker keyword.
ypoints = np.array([3, 8, 1, 10])
plt.plot(ypoints, marker = 'p')
plt.show()
plt.plot([1, 2, 3, 4], [1, 4, 9, 16], 'ro')
plt.axis([0, 6, 0, 20])
plt.show()
The axis() function in the example above takes a list of
[xmin, xmax, ymin, ymax] and specifies the viewport of the axes.
t = np.arange(0., 5., 0.2)
# red dashes, blue squares and green triangles
plt.plot(t, t, 'r--', t, t**2, 'bs', t, t**3, 'g^')
plt.show()

Plotting with keyword string:
There are some instances where you have data in a format that lets you access particular variables with strings.
data = {'a': np.arange(50),
'c': np.random.randint(0, 50, 50),
'd': np.random.randn(50)}
data['b'] = data['a'] + 10 * np.random.randn(50)
data['d'] = np.abs(data['d']) * 100
plt.scatter('a', 'b', c='c', s='d', data=data)
plt.xlabel('entry a')
plt.ylabel('entry b')
plt.show()

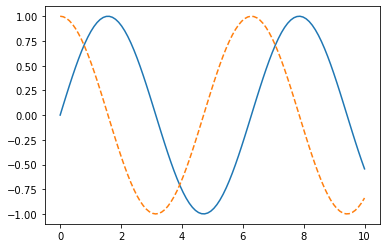
Example:
x = np.linspace(0, 10, 100)
fig = plt.figure()
plt.plot(x, np.sin(x), '-')
plt.plot(x, np.cos(x), '--')
Thank you 😊 for reading. Please read other blogs. And also share with your friends and family.
ꜰᴏʀ ᴇxᴘʟᴏʀɪɴɢ ᴛʜᴇ ᴡᴏʀʟᴅ ᴘʟᴇᴀꜱᴇ ʜᴀᴠᴇ ʟᴏᴏᴋ ᴀɴᴅ ꜰᴏʟʟᴏᴡ.
https://maps.app.goo.gl/jnKyzdDpKMFutUqR7
ʟᴇᴛ ᴍᴇ ᴋɴᴏᴡ ɪꜰ ʏᴏᴜ ʜᴀᴠᴇ ᴀɴʏ Qᴜᴇʀɪᴇꜱ ᴏʀ Qᴜᴇꜱᴛɪᴏɴꜱ.
pratikshagarkar871999@gmail.com


Comments
Post a Comment
If you have any doubt, please let me know. To check my other blog kindly check the following links:
https://pythoholic.blogspot.com/
If you are interested in reading Marathi stories and other stuff, kindly check the following link.
https://pratilipi.page.link/q8dZ4ffZwKPHUx6R9
ꜰᴏʀ ᴇxᴘʟᴏʀɪɴɢ ᴛʜᴇ ᴡᴏʀʟᴅ ᴘʟᴇᴀꜱᴇ ʜᴀᴠᴇ ʟᴏᴏᴋ ᴀɴᴅ ꜰᴏʟʟᴏᴡ.
https://maps.app.goo.gl/jnKyzdDpKMFutUqR7