First Library: Pandas in Python
Pandas is an open-source library. Pandas is a It provides various data structures and operations for manipulating numerical data and time series. This library is built on top of the NumPy library. Pandas is fast and it has high performance & productivity for users.
Pandas data table representation:

How to install Pandas in Python?
Install pandas via pip--> pip install pandas
How to import Pandas?
import pandas
How to Create a data frame using Pandas?
import pandas as pan
df = pan.DataFrame(
{
"Name": [
"Braund, Mr. Owen Harris",
"Allen, Mr. William Henry",
"Bonnell, Miss. Elizabeth",
],
"Age": [22, 35, 58],
"Sex": ["male", "male", "female"],
}
)
print(df)
When using a Python dictionary of lists, the dictionary keys will be used as column headers and the values in each list as columns of the Data frame. Each column in data frame is a series.
When selecting a single column of a pandas Data frame. The result is a pandas Series. To select the column, use the column label in between square brackets
[].How do I select specific columns from a data frame??
print(df['Age'])
type(df["Age"])
sam_column = df[["Age", "Sex"]]
sam_column
How to get maximum value of single column?
df["Age"].max()
- Many pandas operations return a data frame or a series.
How to see first 6 rows of Data Frame?
df.head(6)
To see the first N rows of a Data Frame use the head() method with the required number of rows (in this case 6) as argument.
How to see last 6 rows of Data Frame?
df.tail(6)
To see the last N rows of a Data Frame use the tail() method with the required number of rows (in this case 6) as argument.
How to read csv using pandas?
Pandas provides the read_csv() function to read data stored as a csv file into a pandas data frame. Pandas supports many different file formats or data sources out of the box (csv, excel, sql, json, parquet, …), each of them with the prefix read_*.
How to check column data type?
A check on how pandas interpreted each of the column data types can be done by requesting the pandas dtypes attributes.
How to store data frame in excel sheet?
Whereas read_* functions are used to read data to pandas, the to_* methods are used to store data. The to_excel() method stores the data as an excel file.
df = pan.read_excel("sample.xlsx", sheet_name="passengers")
The method info() provides technical information about a data frame.
How do I select specific row from a data frame?

above_35 = df[df["Age"] > 35]
To select rows based on a conditional expression, use a condition inside the selection brackets []. The condition inside the selection brackets above_35 = df[df["Age"] > 35] checks for which rows the Age column has a value larger than 35.
How to check values are not null?
df[df["Age"].notna()]
The notna() conditional function returns a True for each row the values are not an Null value. As such, this can be combined with the selection brackets [] to filter the data table.
How do I select specific rows and columns from a data frame?
A subset of both rows and columns is made in one go and just using selection brackets [] is not sufficient anymore. The loc/iloc operator are required in front of the selection brackets []. When using loc/iloc, the part before the comma is the rows you want, and the part after the comma is the columns you want to select.
df.loc[df["Age"] > 30, "Name"]
df.iloc[1:3, 0:3]
When selecting specific rows and/or columns with loc/iloc , new values can be assigned to the selected data.
For example, to assign the name female to the first 3 elements of the third column:
df.iloc[0:3, 2] = "female"
How to create plots in pandas?
With data frame, pandas creates by default one line plot for each of the columns with numeric data.
df = pan.read_excel("Sample.xlsx")
df.plot()

How to plot only the columns of the data table with the data?
df['Rural hospitals Beds'].plot()
To plot a specific column, use the selection method in combination with the plot() method. Hence, the plot() method works on both data frame and series.

df.plot.scatter(x="Urban hospitals No.", y="Urban hospitals Beds", alpha=0.5)

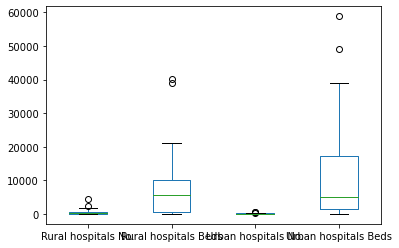
df.plot.box()
One of the options is DataFrame.plot.box() , which refers to a boxplot.
How to create a new columns derived from existing column?
df["Urban hospitals Beds avg"] = df["Urban hospitals Beds"] - 2
print(df.head())

The calculation of the values is done element wise. This means all values in the given column are minus by the value 2 at once. You do not need to use a loop to iterate each of the rows!
How to rename columns name of dataframe?
df = df.rename(columns=str.lower)
The rename() function can be used for both row labels and column labels. Provide a dictionary with the keys the current names and the values the new names to update the corresponding names.
How to combine data from multiple tables?
new_df = pan.concat([df1, df2], axis=0)
The concat() function performs concatenation operations of multiple tables along one of the axis (row-wise or column-wise). By default concatenation is along axis 0, so the resulting table combines the rows of the input tables.

How to calculate summary statistics?
Different statistics are available and can be applied to columns with numerical data. Operations in general exclude missing data and operate across rows by default.
- mean: df["Rural hospitals Beds"].mean()
- median: df[["Rural hospitals Beds", "Urban hospitals Beds"]].median()
- describe: df[["Rural hospitals Beds", "Urban hospitals Beds"]].describe()
df[["States/UTs", "Rural hospitals Beds"]].groupby("States/UTs").mean()
df.groupby("Sex").mean()
How to manipulate textual data?
df["Name"].str.lower()
To make each of the strings in the Name column lowercase, select the Name column add the str accessor and apply the lower method.
df["Name"].str.split(",")
Using the Series.str.split() method, each of the values is returned as a list of 2 elements. The first element is the part before the comma and the second element is the part after the comma.
Thank you 😊 for reading. Please read other blogs. And also share with your friends and
family.
ꜰᴏʀ ᴇxᴘʟᴏʀɪɴɢ ᴛʜᴇ ᴡᴏʀʟᴅ ᴘʟᴇᴀꜱᴇ ʜᴀᴠᴇ ʟᴏᴏᴋ ᴀɴᴅ ꜰᴏʟʟᴏᴡ.
https://maps.app.goo.gl/jnKyzdDpKMFutUqR7
ʟᴇᴛ ᴍᴇ ᴋɴᴏᴡ ɪꜰ ʏᴏᴜ ʜᴀᴠᴇ ᴀɴʏ Qᴜᴇʀɪᴇꜱ ᴏʀ Qᴜᴇꜱᴛɪᴏɴꜱ.
pratikshagarkar871999@gmail.com


Comments
Post a Comment
If you have any doubt, please let me know. To check my other blog kindly check the following links:
https://pythoholic.blogspot.com/
If you are interested in reading Marathi stories and other stuff, kindly check the following link.
https://pratilipi.page.link/q8dZ4ffZwKPHUx6R9
ꜰᴏʀ ᴇxᴘʟᴏʀɪɴɢ ᴛʜᴇ ᴡᴏʀʟᴅ ᴘʟᴇᴀꜱᴇ ʜᴀᴠᴇ ʟᴏᴏᴋ ᴀɴᴅ ꜰᴏʟʟᴏᴡ.
https://maps.app.goo.gl/jnKyzdDpKMFutUqR7